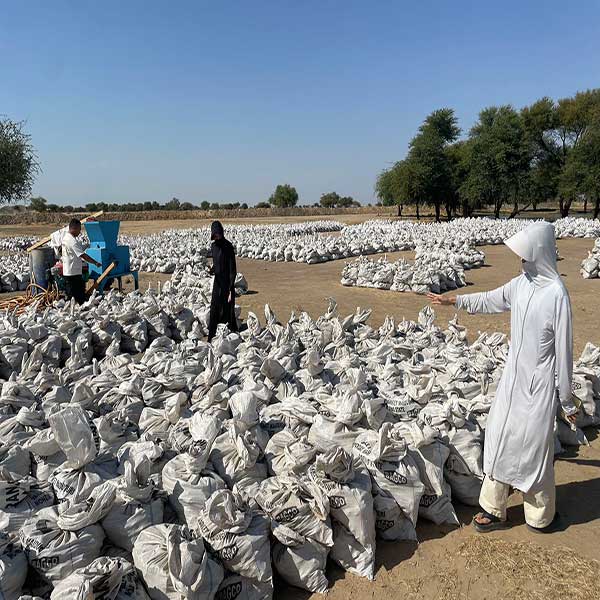
Research Report on the Production Market of Tantalum Niobium Ore in China in 2024
Table 1 Annual Capacity Statistics of Chinese Tantalum Niobium Ore Producers from 2017 to 2023 (Oxide Tons)
Table 2 Statistics of Production Capacity of Tantalum Niobium Ore Producers in China by Province from 2017 to 2023 (Oxide Tons)
Table 3: Capacity Scale Statistics of Chinese Tantalum Niobium Ore Producers from 2017 to 2023 (Oxide Tons)
Table 4 Scale and Type Standards for Chinese Tantalum Niobium Ore Producers in 2023 (Oxide Tons)
Table 5: Capacity Distribution Statistics of Chinese Tantalum Niobium Ore Producers from 2017 to 2023 (in tons of oxides)
Table 6 Annual Statistics of Shutdown Capacity of Chinese Tantalum Niobium Ore Producers from 2017 to 2023 (Oxide Tons)
Table 7 Statistics of shutdown capacity of Chinese tantalum niobium ore producers by province from 2017 to 2023 (in tons of oxides)
Table 8 Statistics of shutdown capacity of Chinese tantalum niobium ore producers from 2017 to 2023 by scale (oxide tons)
Table 9 Statistics of Capacity Shutdown and Allocation of Tantalum Niobium Ore Producers in China from 2017 to 2023 (in tons of oxides)
Table 10 Annual Statistics of New Production Capacity of Chinese Tantalum Niobium Ore Producers from 2017 to 2023 (Oxide Tons)
Table 11 Statistics of New Production Capacity of Tantalum Niobium Ore Producers in China by Province from 2017 to 2023 (Oxide Tons)
Table 12 Statistics of New Production Capacity of Chinese Tantalum Niobium Ore Producers by Scale from 2017 to 2023 (Oxide Tons)
Table 13: Distribution of newly added production capacity of tantalum niobium ore producers in China from 2017 to 2023 (in tons of oxides)
Table 14 Statistics of Production Capacity of Tantalum Niobium Ore Producers in China by Province in 2023 (Oxide Tons)
Table 15: Capacity Scale Statistics of Chinese Tantalum Niobium Ore Producers in 2023 (Oxide Tons)
Table 16: Capacity Distribution Statistics of Chinese Tantalum Niobium Ore Producers in 2023 (Oxide Tons)
Table 17 Annual Outlook for Production Capacity of Chinese Tantalum Niobium Ore Producers from 2024 to 2026 (Oxide Tons)
Table 18: Outlook for the Production Capacity of Tantalum Niobium Ore Producers in China by Province from 2024 to 2026 (Oxide Tons)
Table 19: Outlook for New Production Capacity of Tantalum Niobium Ore Producers in China by Province from 2024 to 2026 (Oxide Tons)
Table 20: Capacity Scale Outlook of Chinese Tantalum Niobium Ore Producers from 2024 to 2026 (Oxide Tons)
Table 21 Outlook for Capacity Distribution of Tantalum Niobium Ore Producers in China from 2024 to 2026 (Oxide Tons)
Table 22 Annual Production Statistics of Chinese Tantalum Niobium Ore Producers from 2017 to 2023 (Oxide Tons)
Table 23: Production Statistics of Tantalum Niobium Ore Producers in China by Province from 2017 to 2023 (Oxide Tons)
Table 24 Statistics of Production Scale of Tantalum Niobium Ore Producers in China from 2017 to 2023 (Oxide Tons)
Table 25 Statistics of Production Distribution of Tantalum Niobium Ore Producers in China from 2017 to 2023 (in tons of oxides)
Table 26 Monthly Production Statistics of Tantalum Niobium Ore Producers in China in 2023 (Oxide Tons)
Table 27: Production Statistics of Tantalum Niobium Ore Producers in China by Province in 2023 (Oxide Tons)
Table 28: Production Scale Statistics of Chinese Tantalum Niobium Ore Producers in 2023 (Oxide Tons)
Table 29 Statistics of Production Distribution of Tantalum Niobium Ore Producers in China in 2023 (Oxide Tons)
Table 30 Annual Outlook for Production of Tantalum Niobium Ore in China from 2024 to 2026 (Oxide Tons)
Table 31: Outlook for Production of Tantalum Niobium Ore in China by Province from 2024 to 2026 (Oxide Tons)
Table 32 Outlook for Production Scale of Tantalum Niobium Ore Producers in China from 2024 to 2026 (Oxide Tons)
Table 33: Outlook for Production Distribution of Tantalum Niobium Ore Producers in China from 2024 to 2026 (Oxide Tons)
Table 34 Annual Statistics of Capacity Utilization Rate of Chinese Tantalum Niobium Ore Producers from 2017 to 2023 (Oxide Tons)
Table 35: Capacity Utilization Rate of Chinese Tantalum Niobium Ore Producers by Province from 2017 to 2023
Table 36 Statistics of Capacity Utilization Rates of Chinese Tantalum Niobium Ore Producers by Scale from 2017 to 2023
Table 37: Decentralized Statistics of Capacity Utilization Rates of Chinese Tantalum Niobium Ore Producers from 2017 to 2023
Table 38 Monthly Statistics of Capacity Utilization Rate of Chinese Tantalum Niobium Ore Producers in 2023 (Oxide Tons)
Table 39: Capacity Utilization Rate of Chinese Tantalum Niobium Ore Producers by Province in 2023 (Oxide Tons)
Table 40 Capacity Utilization Rate of Chinese Tantalum Niobium Ore Producers by Scale in 2023 (Oxide Tons)
Table 41 Distribution Statistics of Capacity Utilization Rates of Chinese Tantalum Niobium Ore Producers in 2023 (Oxide Tons)
Table 42 List of Major Tantalum Niobium Ore Producers in China in 2023 (Oxide Tons)
Table 43 Allocation of Factors Influencing the Trend of Production Capacity of Tantalum Niobium Ore Producers in China by Province - Comprehensive Allocation
Table 44: Factors Influencing the Trend of Production Capacity of Chinese Tantalum Niobium Ore Producers by Province - Natural Endowment
Table 45: Allocation of Factors Influencing the Trend of Production Capacity of Tantalum Niobium Ore Producers in China by Province - Local Policies
Table 46: Allocation of Factors Influencing the Trend of Production Capacity of Chinese Tantalum Niobium Ore Producers by Province - Industrial Supporting Facilities
Table 47: Factors Influencing the Trend of Production Capacity of Chinese Tantalum Niobium Ore Producers by Province - Human Preferences
 LME warehouse z...


